Economic outlook
The New Zealand economy is emerging from a protracted recession. Tight monetary policy was implemented to bring down inflation that peaked at 7.3 per cent in 2022. High interest rates constrained demand and, as a result, economic growth has been low, or negative, in successive quarters. Since the September quarter of 2022, per capita GDP has fallen 4.6 per cent, making the current downturn a deeper per-capita recession than the global financial crisis.
A turning point has been reached. Annual Inflation is back in the target band, and close to the 2 per cent midpoint. The Reserve Bank has begun reducing interest rates, with the Official Cash Rate down 125 basis points since August. As interest rates fall, household spending and business activity is expected to lift. The HYEFU forecasts show an economic recovery, with growth strengthening over the next year and beyond, and unemployment declining from mid-2025.
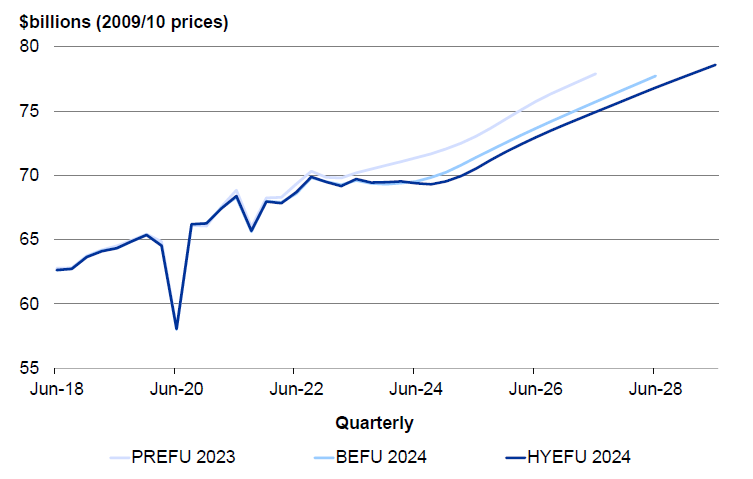
The Treasury's forecasts have long anticipated this recovery. However, the outlook - while remaining positive - has typically become weaker with each new set of forecasts. Figure 5 shows recent changes in real GDP forecasts.
Figure 5 - Real GDP forecast changes

Sources: Stats NZ, the Treasury
There are two key reasons economic forecasts have deteriorated, and these are independent of government policy. One is a better understanding of the present downturn, which started earlier, was deeper, and has persisted for longer, than was previously understood or expected. The other is the Treasury's evolving assessment of productivity trends. With the benefit of hindsight, earlier economic forecasts attributed too much weight to an apparent pickup in productivity during the COVID-19 pandemic, which did not persist. Earlier forecasts were too optimistic about future economic growth, and that optimism has been unwound over successive updates, including the HYEFU.
The economic outlook is therefore weaker than in the BEFU. Across the four years to June 2028, forecasts of nominal GDP are a cumulative $20 billion (just over 1 per cent) lower than in the BEFU (Table 1). Nominal GDP is the single biggest driver of tax revenue. Weaker GDP forecasts contribute to tax revenue being cumulatively around $13 billion lower over the period to June 2028, compared to the BEFU. Tax revenue forecasts flow through to the fiscal outlook, as tax revenue is by far the Government’s largest source of revenue.
Table 1 - Changes in nominal GDP and core Crown tax revenue forecasts
| Year ending 30 June $billions |
2025 | 2026 | 2027 | 2028 | 2029 |
|---|---|---|---|---|---|
| Nominal GDP | |||||
| HYEFU 2024 | 427.3 | 450.4 | 473.2 | 495.4 | 517.7 |
| BEFU 2024 | 430.6 | 454.5 | 478.5 | 502.5 | |
| Change | -3.3 | -4.1 | -5.3 | -7.1 | |
| Tax revenue | |||||
| HYEFU 2024 | 120.6 | 128.3 | 136.7 | 144.1 | 151.2 |
| BEFU 2024 | 122.9 | 131.4 | 140.2 | 148.2 | |
| Change | -2.3 | -3.1 | -3.5 | -4.1 |
Source: The Treasury