The Public Finance Act 1989 requires the Minister of Finance to present to the House on Budget Day a report on the Government's fiscal strategy. This must set out the Government's short-term fiscal intentions, long-term fiscal objectives, revenue strategy, and strategy for managing expenditure, assets and liabilities. The report must include fiscal projections for at least the next 10 years.
Fiscal and economic context
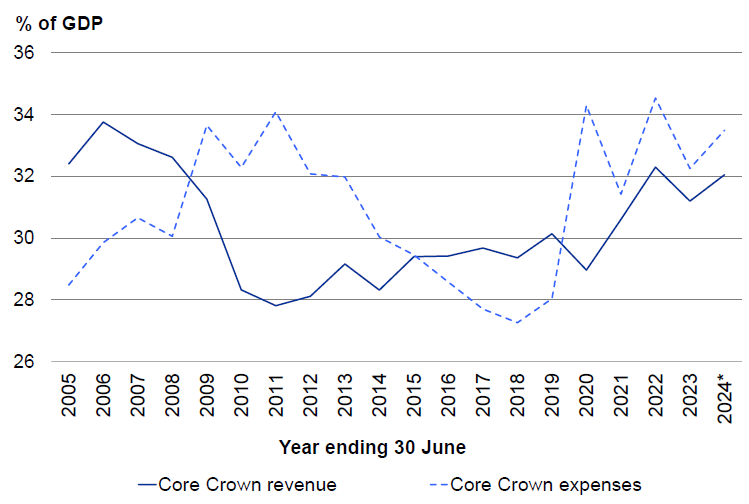
New Zealand's fiscal position has deteriorated markedly over the last five years. The OBEGAL[1] - the difference between government revenue and expenses (before gains and losses) - has been in deficit since 2019/20, largely because of increases in core Crown expenses (Figure 1). While some spending increases were temporary - for example, in response to the COVID-19 pandemic and the 2023 North Island weather events - there was a permanent increase in other areas. Budget operating allowances from 2018 to 2023 averaged $4.1 billion, more than four times the average allowance across Budgets 2009 to 2017 (historical allowances are shown in Figure 5). In addition, a considerable amount of discretionary spending was not counted against allowances.
Figure 1 — Core Crown revenue and expenses

* 2024 shows the latest forecast.
Source: The Treasury
After stripping out large one-off expenses and adjusting for the economic cycle, the Treasury estimates a structural operating deficit of around 1.5 per cent of GDP in 2023/24. A structural deficit is not sustainable in the long term as it would require continual borrowing to cover expenses, leading to an accumulation of public debt.
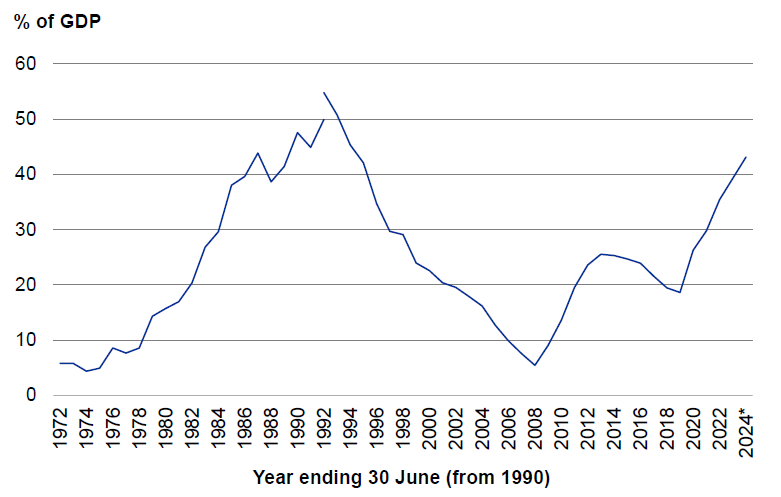
Operating deficits over several years have already contributed to rapidly rising debt (Figure 2). This increase in debt has reduced New Zealand's ability to weather future shocks. New Zealand needs a healthy public balance sheet as, in comparison to many other countries, it is a small economy, vulnerable to natural disasters, reliant on commodity exports and dependent on international lenders. The increase in debt also needs to be serviced. As debt, and interest rates, have risen over recent years, core Crown financing costs have grown to a forecast $8.9 billion in the current financial year.
Figure 2 — Net core Crown debt

* 2024 shows the latest forecast.
The measure of net core Crown debt adopted in 2009 is only restated back to 1992. The earlier measure for the period before 1992 included advances.
Source: The Treasury
Fiscal consolidation is required to bring revenue and expenses back into balance. The Government is committed to reducing core Crown expenses as a proportion of GDP, reducing net core Crown debt as a proportion of GDP, and returning to an OBEGAL surplus.
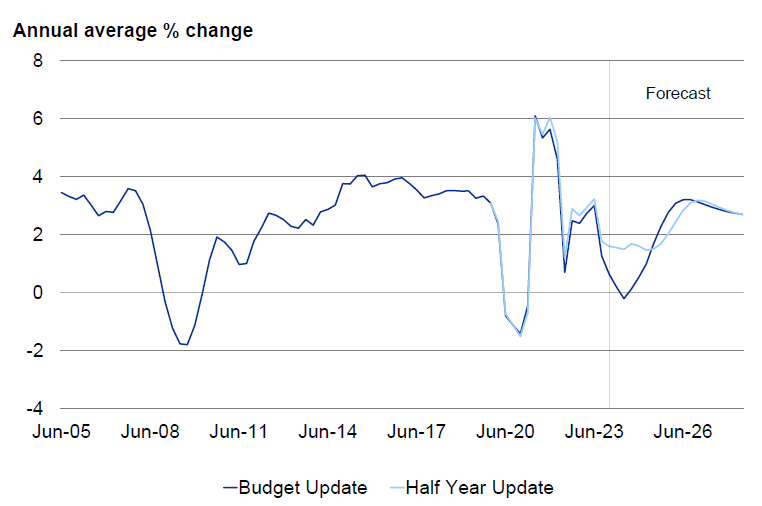
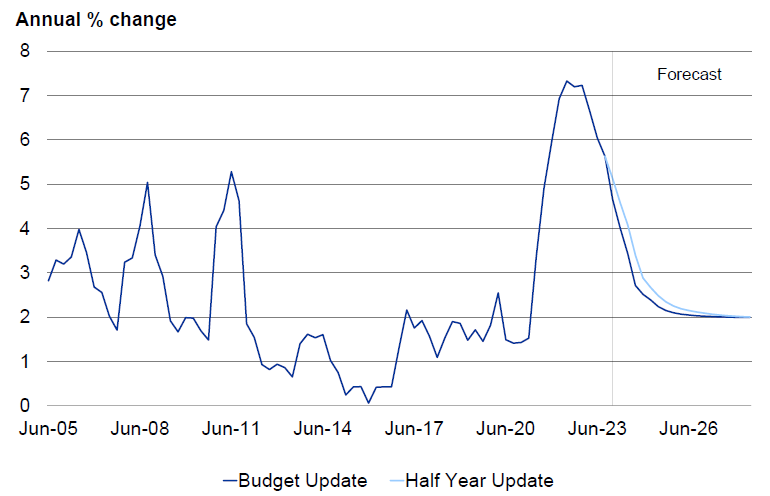
These fiscal goals have become harder to achieve as economic forecasts have deteriorated. New Zealand is experiencing an economic downturn as interest rates have been increased to tackle high inflation (Figures 3 and 4). What has become apparent over the last six months is that the downturn started earlier, has been deeper, and is likely to last for longer, than previously thought. The Treasury has therefore downgraded its forecasts for nominal GDP in the Budget Economic and Fiscal Update 2024 (Budget Update). By the end of the forecast period, the cumulative level of nominal GDP is $46 billion lower on these forecasts compared to the forecasts in the Half Year Economic and Fiscal Update 2023 (Half Year Update) in December (Table 1).[2]
This downgrade to nominal GDP, and lower forecast business income tax, results in lower forecast core Crown tax revenue of around $18.5 billion over the period, compared to the Half Year Update. Without correspondingly lower expenses, lower forecast tax revenue flows through into the operating balance and government debt. Lower nominal GDP also means that reducing expenses and debt as a proportion of GDP becomes more difficult.
Figure 3 — Real GDP growth

Sources: Stats NZ, the Treasury
Figure 4 — CPI inflation

Sources: Stats NZ, the Treasury
Table 1 — Nominal GDP: Budget Update, Half Year Update and difference
| Year ending 30 June $billions |
2024 Forecast |
2025 Forecast |
2026 Forecast |
2027 Forecast |
2028 Forecast |
|---|---|---|---|---|---|
| Half Year Update 2023 | 420.0 | 439.7 | 463.6 | 488.6 | 513.0 |
| Budget Update 2024 | 413.1 | 430.6 | 454.5 | 478.5 | 502.5 |
| Difference | -6.9 | -9.1 | -9.1 | -10.1 | -10.5 |
Source: The Treasury