Fiscal forecasts and projections
For Budget 2024, fiscal forecasts have been prepared for the period 2023/24 to 2027/28. These forecasts are summarised in Table 5. Longer-term projections have been prepared out to 2037/38.[8]
Table 5 — Key fiscal indicators from the Budget Update
| Year ending 30 June | 2023 Actual |
2024 Forecast |
2025 Forecast |
2026 Forecast |
2027 Forecast |
2028 Forecast |
|---|---|---|---|---|---|---|
| $billions | ||||||
| Core Crown tax revenue | 112.4 | 119.0 | 122.9 | 131.4 | 140.2 | 148.2 |
| Core Crown revenue | 123.4 | 132.4 | 136.0 | 144.2 | 153.1 | 161.7 |
| Core Crown expenses | 127.6 | 138.3 | 143.9 | 147.7 | 151.1 | 156.4 |
| Total Crown OBEGAL | -9.4 | -11.1 | -13.4 | -8.5 | -3.1 | 1.5 |
| Net core Crown debt | 155.3 | 178.1 | 187.3 | 195.4 | 207.4 | 209.9 |
| Net worth | 191.5 | 189.2 | 182.0 | 180.1 | 184.2 | 193.4 |
| Net worth attributable to the Crown | 183.5 | 180.9 | 173.6 | 171.7 | 175.7 | 184.8 |
| % of GDP | ||||||
| Core Crown tax revenue | 28.4 | 28.8 | 28.5 | 28.9 | 29.3 | 29.5 |
| Core Crown revenue | 31.2 | 32.0 | 31.6 | 31.7 | 32.0 | 32.2 |
| Core Crown expenses | 32.3 | 33.5 | 33.4 | 32.5 | 31.6 | 31.1 |
| Total Crown OBEGAL | -2.4 | -2.7 | -3.1 | -1.9 | -0.6 | 0.3 |
| Net core Crown debt | 39.3 | 43.1 | 43.5 | 43.0 | 43.3 | 41.8 |
| Net worth | 48.4 | 45.8 | 42.3 | 39.6 | 38.5 | 38.5 |
| Net worth attributable to the Crown | 46.4 | 43.8 | 40.3 | 37.8 | 36.7 | 36.8 |
Source: The Treasury
Core Crown expenses are forecast to decline from 2024/25 as a proportion of GDP, in line with the limited growth in spending. Core Crown expenses are forecast to fall below core Crown revenue from 2026/27 onwards. This does not imply an OBEGAL surplus in 2026/27, however. OBEGAL is a total Crown measure and therefore includes the results of Crown entities, which are negative over the forecast period (Annex 1). Core Crown expenses as a share of GDP continue to fall over the projection period, reaching 30 per cent of GDP in 2031/32, consistent with the Government's long-term objective for expenses (Figure 7).
Figure 7 — Core Crown revenue and expenses
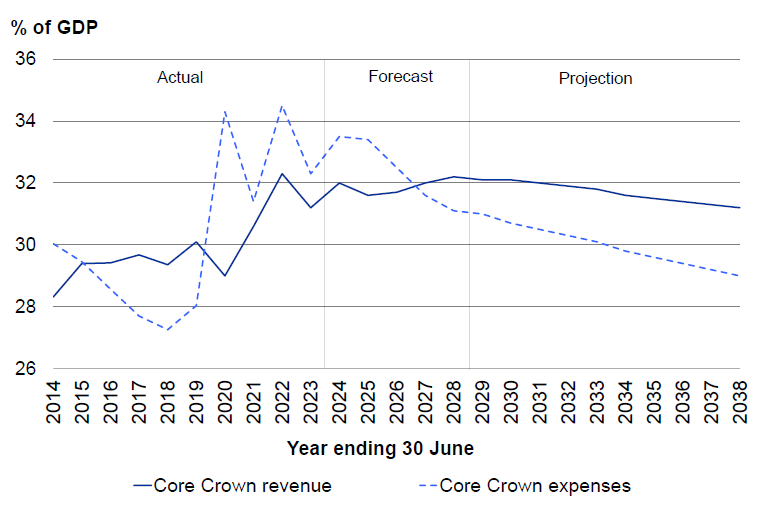
Source: The Treasury
The revenue and expense tracks lead to growing OBEGAL surpluses (Figure 8). OBEGAL surpluses average 1.2 per cent of GDP over the projection period. Maintaining surpluses ensures that, on average over a reasonable period of time, operating expenses are funded from operating revenues and not from debt.
Figure 8 — OBEGAL
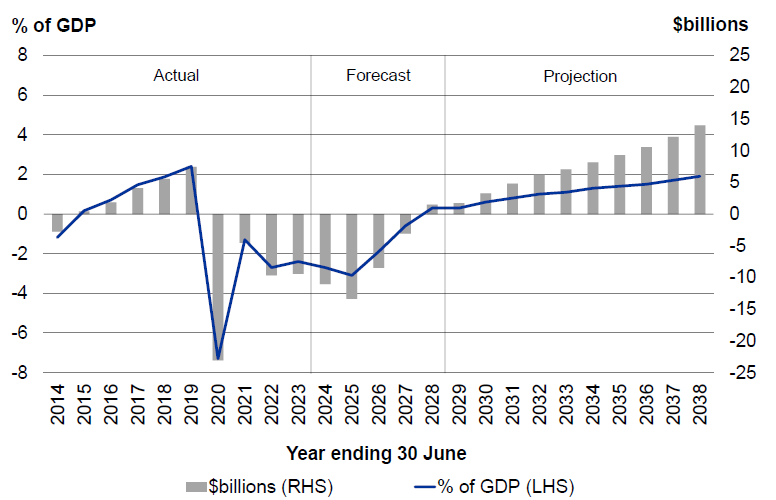
Source: The Treasury
An OBEGAL surplus of $1.5 billion is forecast in 2027/28, consistent with the Government's short-term intention for the operating balance. Retaining the operating allowances from the Half Year Update (set by the previous Government and using reasonable assumptions to extend them into future years) would delay the return to surplus to at least 2030/31.
The OBEGAL deficit is forecast to be slightly higher in 2024/25 than it is in the current year. Of the $7.2 billion decline in the 2024/25 OBEGAL since the Half Year Update, $1.1 billion is due to decisions around the Budget operating package, with the remaining $6.1 billion due to other factors including the impact from economic conditions outside the Government's control (mainly tax forecasting changes - see Table 2.1 in the Budget Update). This is a matter of timing, however, as there is an equivalent $1.1 billion saving in the operating package in 2023/24. Over the two years combined, discretionary policy has no impact on the OBEGAL compared to the Half Year Update.
Net core Crown debt as a percentage of GDP stops rising in the forecast period before declining from 2026/27. It falls below 40 per cent of GDP in 2029/30 and continues to fall over the remainder of the projection period (Figure 9). Projections of net core Crown debt are within the range of 20 per cent to 40 per cent of GDP, consistent with the Government's long-term objective for debt. Figure 9 indicates that careful fiscal management will, over time, rebuild the fiscal buffers that have supported New Zealand through past economic shocks and natural disasters.
Figure 9 — Net core Crown debt
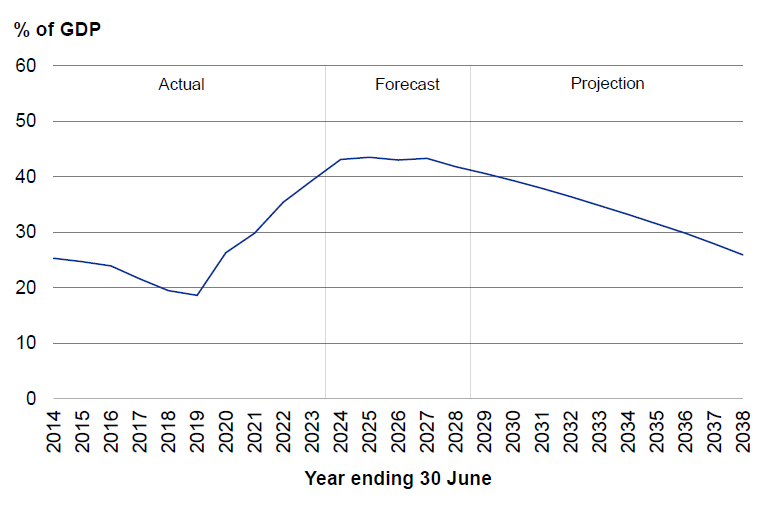
Source: The Treasury
Compared to the Pre-election Update 2023, when fiscal projections were last published, the OBEGAL track in the projection period has improved materially, which flows through to a faster reduction in net core Crown debt across the projection period. This revision to the fiscal projections primarily reflects lower operating allowances over an extended period.
The assumptions behind the updated fiscal projections are discussed further in Annex 2, and scenarios illustrating the risks to the projections are presented in Annex 3.
Box 2 - Supporting monetary policy to tackle inflation
The Government's fiscal consolidation is helping support the Reserve Bank in tackling inflation and means that, in the medium term, interest rates may be lower than would otherwise be the case. On average across the forecast period, the fiscal impulse (a measure of the change in the Government's fiscal contribution to aggregate demand from one year to the next) is very similar to what was forecast at Half Year Update. However, due to movements in the forecasts and Government decisions the profile has changed. The fiscal impulse in 2024/25 is broadly neutral and from 2025/26 onwards is expected to be less stimulatory than forecast at the Half Year Update. The change in the 2024/25 impulse partly reflects lower government spending in 2023/24 but also a weaker economy generating less tax revenue. The downward revisions to the fiscal impulse from 2025/26 onwards reflect the impact of lower Budget operating allowances. Modelling from the Treasury suggests that the impact of tax reductions offset by lower spending is likely to modestly reduce pressure on interest rates.
Figure 10 — Fiscal impulse
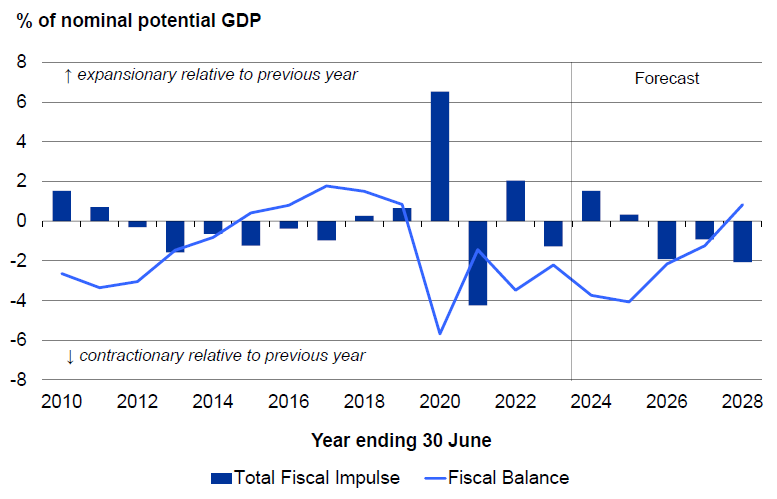
Source: The Treasury
Note
- [8] A full set of projections, including other fiscal variables such as total operating expenses, total operating revenue, and gross debt, is available in the Fiscal Strategy Model on the Treasury website.